Publications

Follow via RSS

Nigeria Economic Update, Issue 15

According to recent data from the Debt Management Office (DMO), Nigeria’s total public debt stood at ₦159.28 trillion in December 2025, up from ₦153.29 trillion in September 2025, representing a quarterly increase of ₦5.99 trillion (3.90%). A year-on-year comparison shows that total public debt rose by ₦14.61 trillion from ₦144.67 trillion in December 2024, representing a 10.10 percent rise over the period. A breakdown of the debt stock in December 2025 indicates that external debt amounted to ₦74.43 trillion, accounting for 46.73 percent of total public debt. Of this amount, the Federal Government held ₦66.27 trillion, while the States and the Federal Capital Territory accounted for ₦8.16 trillion. Domestic debt was higher at ₦84.85 trillion, representing 53.27 percent of the total, with the Federal Government responsible for ₦80.49 trillion and the States and the FCT for ₦4.36 trillion. This structure highlights the continued dominance of domestic borrowing and the significantly larger debt burden borne by the Federal Government relative to subnational governments. It also demonstrates a sustained reliance on borrowing to meet financing needs, with domestic instruments remaining the primary source of funding. To manage rising debt exposure, fiscal policy should prioritise enhanced non-oil revenue mobilisation to reduce dependence on borrowing, improve expenditure efficiency to contain recurrent spending pressures, and gradually increase reliance on concessional external financing to moderate debt servicing costs.

Read More Download PDF

Nigeria Economic Update, Issue 14

According to the National Bureau of Statistics (NBS), Company Income Tax (CIT) collections stood at ₦1.49 trillion in Q4 2025, reflecting a significant quarter-on-quarter decline of 49.81 percent from ₦2.96 trillion recorded in Q3 2025. Domestic CIT accounted for ₦819.83 billion, while foreign CIT contributed ₦668.21 billion in the quarter under review. Despite the quarterly drop, collections grew by 13.38 percent year-on-year, indicating some underlying resilience. Sectoral performance was mixed, with activities of extraterritorial organisations and bodies, education, and real estate activities recording the strongest growth, while accommodation and food service activities, activities of households as employers, and mining experienced sharp contractions. Financial and insurance activities, manufacturing, and mining and quarrying remained the least contributors to CIT. The sharp quarter-on-quarter decline suggests fluctuations in corporate earnings and possible timing effects in tax remittances, particularly from key sectors such as mining and manufacturing. The divergence between strong year-on-year growth and weak quarter-on-quarter performance indicates that while overall economic activity may be improving, it remains uneven and susceptible to sector-specific shocks. The concentration of tax contributions in a few sectors also highlights structural imbalances in the tax base. Policy efforts should focus on broadening the Corporate Income Tax (CIT) base by enhancing compliance across underperforming sectors and reducing reliance on a narrow set of industries. Strengthening tax administration, improving transparency in remittance processes, and supporting sectoral diversification, particularly in non-extractive industries, is critical. Furthermore, stabilising the macroeconomic environment to support business profitability can help ensure more consistent and sustainable tax revenues over time. Most business activities in Nigeria are also largely informal; hence, they are difficult to tax. Thus, efforts should be geared towards the formalisation of businesses to enable their inclusion into the tax net, but such measures will be more effective if these businesses are able to hold the government accountable.

Read More Download PDF

Nigeria Economic Update, Issue 13

According to the National Bureau of Statistics’ (NBS) Selected Food Price Watch report for February 2026, the average price of brown beans (1 kg) stood at ₦1,307.44, reflecting a 46.98 percent year-on- year (YoY) decline from ₦2,465.96 in February 2025 but a 3.57 percent month-on-month (MoM) rise from January 2026. Similarly, the price of locally produced rice (1 kg) averaged ₦1,858.93 in the month under review, an 11.01 percent YoY drop from ₦2,088.82, though it increased 0.93 percent MoM from ₦1,841.83 in January. The price of garri (white, 1 kg sold loose) averaged ₦790.62, down 38.10 percent YoY but up 2.42 percent from January 2026. Likewise, the average prices of tomatoes (1 kg, sold loose) fell 3.03 percent YoY to ₦1,077.43 yet rose 5.15 percent MoM. Similarly, the average price of small white crayfish (1 kg) surged 36.41 percent YoY to ₦8,785.16, while also increasing 1.44 percent MoM. Across states, Oyo recorded the highest average price for brown beans (1 kg) at ₦1,924.61, while Taraba had the lowest at ₦700.00. Kogi reported the highest average price for locally produced rice (1 kg) at ₦2,167.92, compared with ₦1,544.78 in Bauchi. Abia recorded the highest average price for garri white (1 kg) at ₦1,071.37, while Bauchi had the lowest at ₦500.00. Edo State saw the highest average tomato (1 kg) price at ₦1,470.30, versus ₦694.68 in Kaduna. The observed price dynamics and interstate disparities point out the urgent need for coordinated policy interventions, particularly in addressing insecurity in key food-producing regions, which continues to disrupt agricultural output, supply chains, and rural livelihoods. Strengthening transport and logistics infrastructure, expanding storage and processing facilities, and improving farmers’ access to inputs and credit would reduce post-harvest losses and stabilise prices across regions and mitigate inflationary pressures, Output, supply chains, and rural livelihoods.

Read More Download PDF

Nigeria Economic Update, Issue 12

According to the Central Bank of Nigeria, Nigeria recorded a lower balance of payments surplus of US$2.67 billion in the fourth quarter of 2025, compared with US$4.60 billion in the third quarter, indicating a moderation in external sector performance during the period. The current account balance also declined sharply to US$1.40 billion from US$4.06 billion in the Q3 2025, largely as a result of a weaker goods account balance, lower crude oil and refined petroleum exports, higher non-oil imports, and increased net outflows in the primary income account. The goods account balance fell to US$1.77 billion from US$4.53 billion, as crude oil exports declined to US$6.77 billion while non-oil imports rose to US$8.77 billion. At the same time, the secondary income account improved to US$6.21 billion, supported by an increase in workers’ remittances to US$5.72 billion, while the financial account recorded higher net borrowing of US$1.96 billion, driven mainly by increased portfolio investment liabilities of US$5.27 billion. Despite the weaker current account position, external reserves increased to US$45.75 billion at the end of December 2025, up from US$42.77 billion at the end of September 2025. Overall, the fourth quarter outcome highlights the continued vulnerability of the Nigerian economy to export volatility and rising import pressures. It also underscores the need to strengthen non-oil export performance, improve the resilience of the external sector, and sustain measures that support reserve accumulation and broader macroeconomic stability.

Read More Download PDF

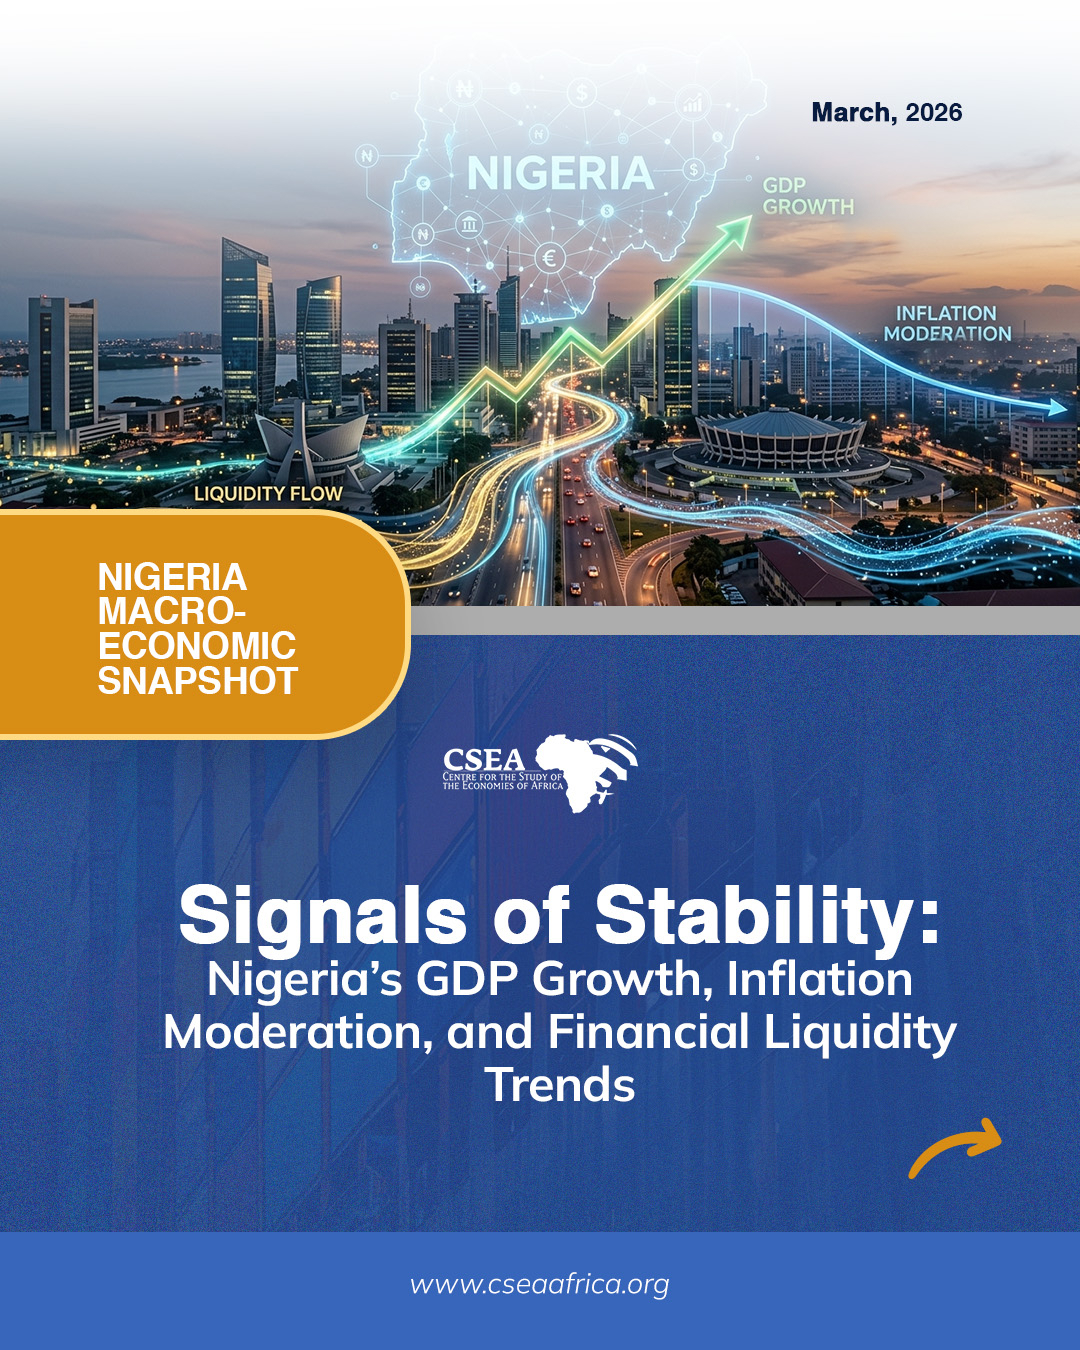
Nigeria Economic Snapshot March 2026

Nigeria's headline inflation rate over the twelve-month period under review shows
a steady decline in price pressures across the economy. Inflation stood at  27.6°k in January 2025, fluctuated lightly in the early months, and then began a consistent downward trend through the rest of the year. By the end of the final quarter of 2025, inflation  had  fallen to 19.0%  in October,  17.3%  in  November, and 15.1%  in December, before remaining at 15.1°kin January 2026. These changes represent a significant fall in headline inflation rate this year compared to the same period of last year. Overall, the  sustained decline suggests improving price stability in the economy, reflecting  slower  increases  in  the  average  price  level of  goods  and   services 
consumed my households.
 

Read More Download PDF

Nigeria Economic Update, Issue 11

According to the National Bureau of Statistics’ (NBS) Q4 2025 Foreign Trade in Goods Statistics, Nigeria’s total merchandise trade stood at ₦36,214.34 billion in the fourth quarter of 2025, representing a decline of 1.07% from the ₦36,604.83 billion recorded in the corresponding quarter of 2024 and a decrease of 8.94% from ₦39,771.47 billion in the third quarter of 2025. This decline was driven largely by a fall in crude oil exports. Despite the decline in overall trade, the merchandise trade balance remained positive at ₦1,712.48 billion, indicating continued resilience in the external sector.During the quarter under review, total exports were valued at ₦18,963.41 billion, accounting for 52.36% of total merchandise trade, while imports amounted to ₦17,250.93 billion, representing 47.64% of total trade. Imports also increased by 3.98% from ₦16,590.51 billion in the fourth quarter of 2024 and by 1.73% from ₦16,957.90 billion in the third quarter of 2025. Crude oil remained the dominant export commodity, valued at ₦9,702.87 billion, and accounting for 51.17% of total exports. While the positive trade balance suggests some degree of external-sector strength, the decline in total merchandise trade underscores the economy’s continued vulnerability to fluctuations in global oil prices and domestic production levels. Moreover, the rise in imports alongside declining exports points to increasing demand for foreign goods relative to domestic output, a trend that could place further pressure on the trade balance over time. In light of these factors, policy should focus on strengthening non-oil export performance through improved domestic production capacity, higher competitiveness, and greater value addition. At the same time, efforts to support local industries and reduce import dependence will be essential for improving trade sustainability and strengthening the resilience of the economy.

Read More Download PDF

Nigeria Economic Update, Issue 10

According to the OPEC Monthly Oil Market report for March 2026, Nigeria’s crude oil production averaged 1.314 million barrels per day (mbpd) in February 2026, down from 1.459 mbpd in January and below its OPEC quota of 1.5 mbpd. This marks the seventh consecutive month since August 2025 that the country has failed to meet its assigned quota. The shortfall reflects persistent operational challenges in the oil sector, including security concerns, pipeline vandalism, oil theft, and  infrastructural constraints that limit production capacity. As Nigeria’s budget and foreign exchange inflows remain heavily  dependent on oil earnings, continued underperformance reduces export volumes and potential revenue, particularly during  periods of favourable global oil prices. Addressing this trend requires strengthening security in oil-producing regions,  increasing investment in upstream infrastructure, and improving regulatory efficiency to attract greater investor participation.

Read More Download PDF

Nigeria Economic Update, Issue 9

Data from the Nigerian Foreign Exchange Market (NFEM) published by the Central Bank of Nigeria (CBN) shows that the exchange rate averaged ₦1,355.53/US$ in February 2026, representing a 4.49 percent month-on-month appreciation from the average of ₦1,416.52/US$ in January 2026 and a 10.73 percent year-on-year improvement from ₦1,500.97/US$ in February 2025. On 17 February 2026, the exchange rate strengthened to ₦1,335.96/US$, its strongest attained since 29 May 2024 (₦1,197.11/US$). The Monetary Policy Committee (MPC), at its 304th meeting, noted the strong performance of Nigeria’s external sector, with rising export earnings and remittance inflows boosting foreign exchange reserves and supporting stability in the foreign exchange market. To further strengthen the Naira and enhance exchange rate stability, Nigeria should bolster foreign reserves by increasing both oil and non-oil export earnings while reducing import dependence. Enhancing oil receipts requires greater investment in production infrastructure and stronger measures to curb oil theft and pipeline vandalism. Strengthening non-oil receipts requires the implementation of export promotion policies, which should include targeted tax incentives for micro, small, and medium-sized enterprises (MSMEs) and the provision of adequate infrastructure. 

Read More Download PDF

Nigeria Economic Update, Issue 8

The National Bureau of Statistics’ Premium Motor Spirit Price Watch report for January 2026 revealed that the average retail price of petrol stood at ₦1,034.76 during the month under review. This represents a 17.77% year-on-year decrease from ₦1,258.34 recorded in January 2025, and a 1.32% decline relative to ₦1,048.63 recorded in December 2025. The reduction in fuel prices reflects increased domestic production from the Dangote Refinery and enhanced market competition following the removal of the fuel subsidy. State-level analysis reveals considerable variation in retail prices across the country. Cross River State recorded the highest average price at ₦1,171.77, followed by Rivers at ₦1,160.92 and Nasarawa at ₦1,149.13. In contrast, Ekiti, Enugu and Kaduna States reported the lowest average prices at ₦946.90, ₦946.92. and ₦947, respectively. At the zonal level, the South-South recorded the highest average price at ₦1,076.04, while the South-West posted the lowest at ₦1,009.30. The decline in PMS prices suggests improved fuel supply conditions and distribution efficiency, with potential positive spillover effects on transport and production costs nationwide. Nevertheless, persistent interstate price disparities point to underlying logistical constraints in certain regions. To sustain price stability, the government should continue to strengthen domestic refining capacity, improve transport and storage infrastructure, and enhance market monitoring to reduce regional imbalances.

Read More Download PDF