Balance Of Trade (Export And Import)
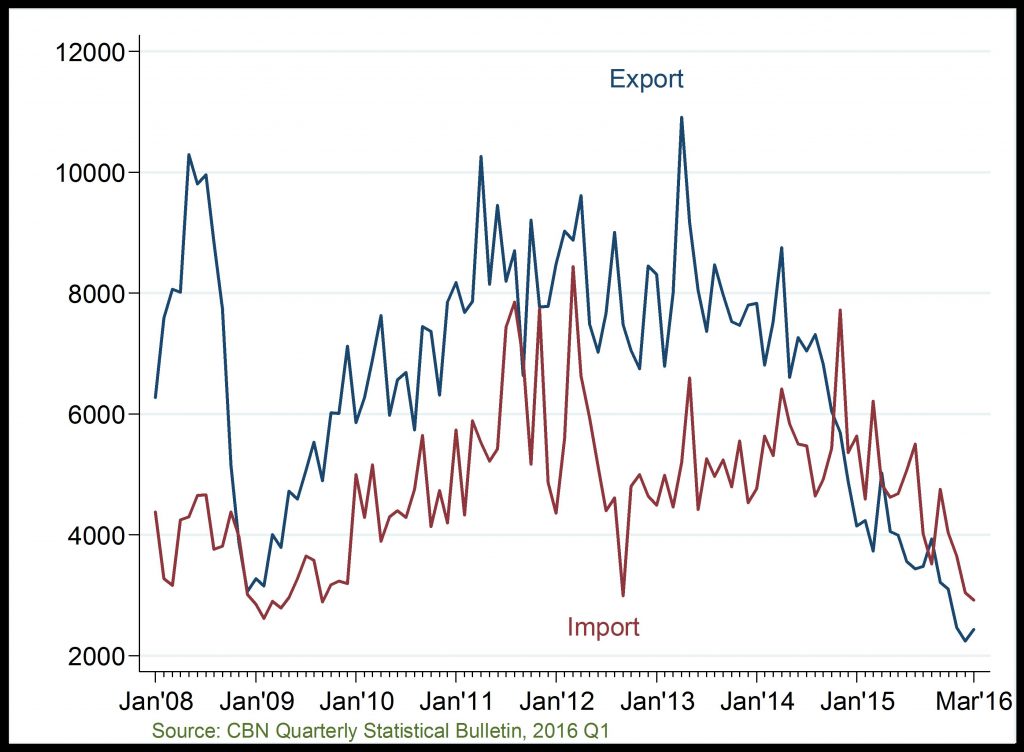
Export and Import (US$ Million)
Buying and selling less, post-2014
Balance of Trade (US$ Million)
The preponderance of trade deficits, post-2014Q2
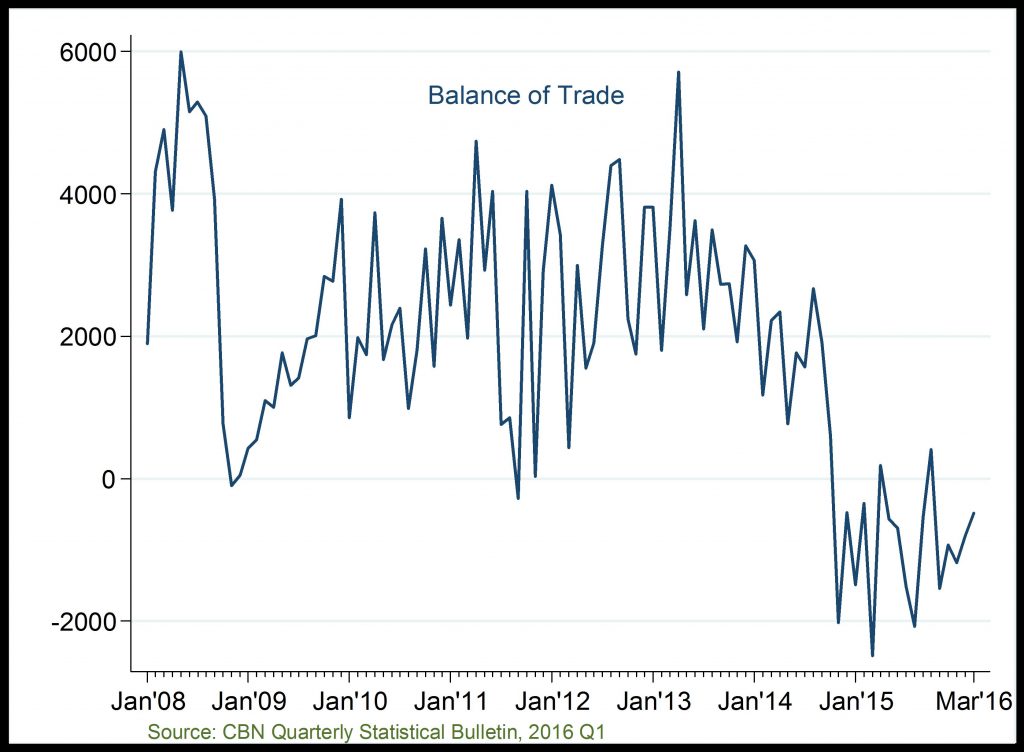
Balance of Trade (Export and Import): With export and, to lesser extent, import declining balance of trade fell deeply in 2015 and, to lesser extent, in 2016Q1.
Related
Net Foreign Exchange Flows through the Nigerian Economy: The recent fall in foreign exchange earnings reflects the decline in both oil sector receipts from CBN, and non-oil sector inflows from autonom
Gross Federally Collected Revenue: Both oil and non-oil components of gross federal revenue fell below N40 billion in 2016, after recording a peak of N90 billion in 2013. The decline was most prominen
Gross Domestic Product Growth Rate: The information and communication sector has grown overtime but witnessed an unusual decline in 2011, which has remained low in 2016Q1 possibly due to declining con
Export and its Components: In 2015 and 2016Q1, overall export earnings declined significantly to a record low of less than $3000 million in 2016Q1, as against the peak of above $10,000 million in 2008