Gross Federally Collected Revenue
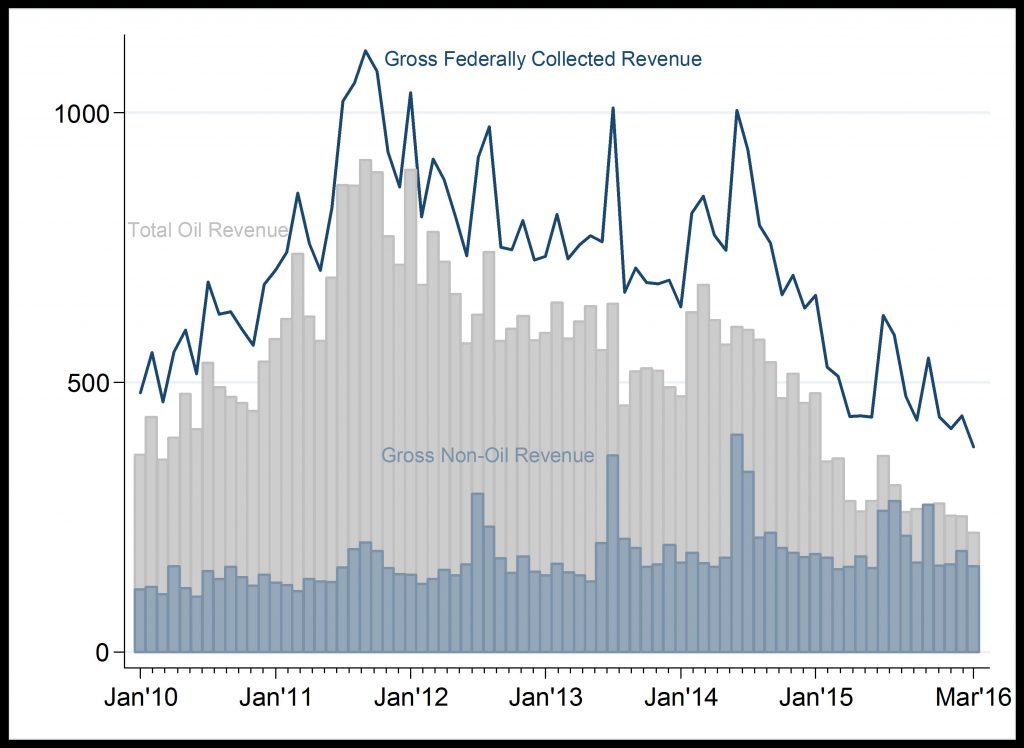
Gross Federally Collected Revenue (Billion )
Falling government revenue
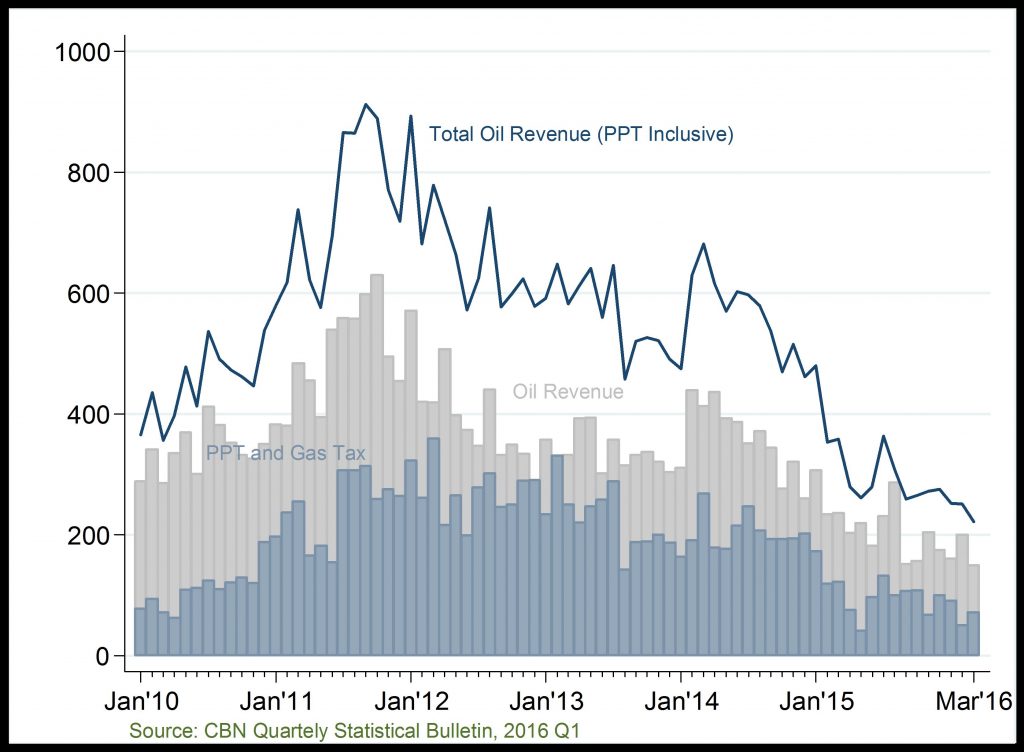
Total Oil Revenue and its Components (Billion )
Declining oil revenue
Gross Federally Collected Revenue: Both oil and non-oil components of gross federal revenue fell below N40 billion in 2016, after recording a peak of N90 billion in 2013. The decline was most prominent in oil revenue sources due to low oil price and production shortages. On the other hand, non-oil revenue has attained an increasing one-year peak in second half of every year since 2011; reaching nearly to N400 billion by 2014. However, non-oil revenue declined to a trough of less than N200 billion in the latter end of 2015H1 and 2016Q1 due to present challenges in the business environment.
Related
External Reserve: External reserve picked up from its year-2000 level below $10,000 million to above $60,000 million in 2008. However, the external reserve fell deeply in 2010/11 and even further in 2
Gross Domestic Product Growth Rate: The information and communication sector has grown overtime but witnessed an unusual decline in 2011, which has remained low in 2016Q1 possibly due to declining con
On average, Nigerias GDP growth rate has averaged about 5 percent; attaining an unusual trough of nearly -10 percent in 2003Q4 and a peak of nearly 20 percent in 2004Q4. However, the Nigerian economy
Crude Oil Price: Crude oil price attained a historical low of $30.7 in January 2016 largely due to excess global oil supply.
Crude Oil Production and Export: Oil production has continued to fall in