Gross Domestic Product Growth Rate And Contribution To GDP
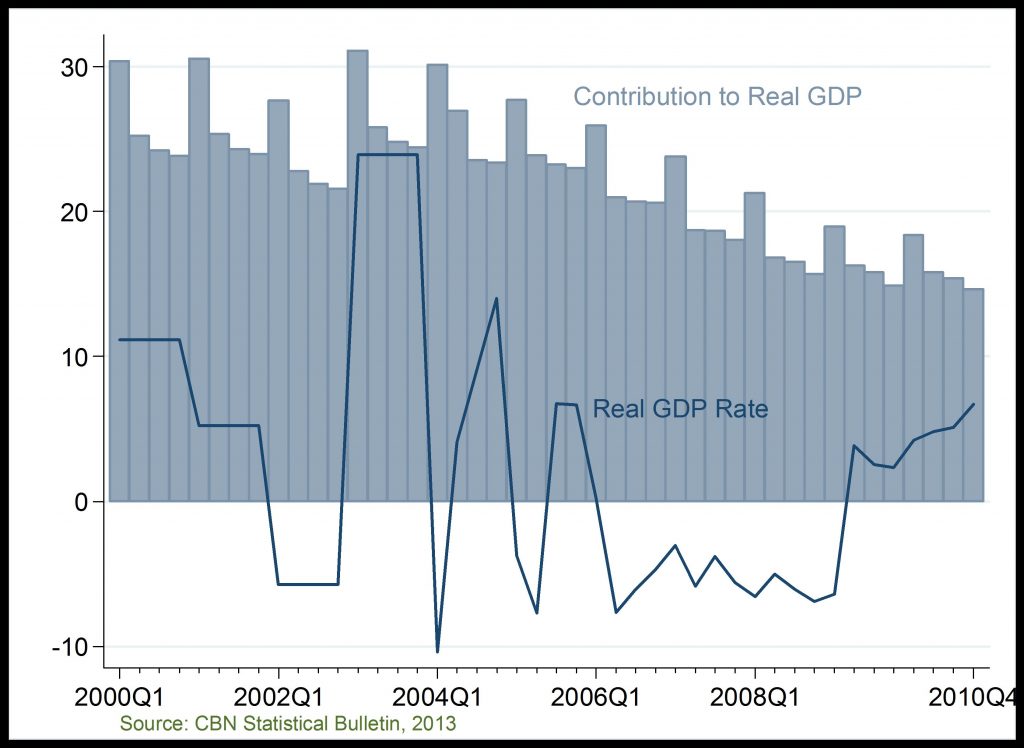
Real GDP at 1990 Base Year
Oil and gas sector GDP growth peak in 2003 Q2-Q3
Real GDP at 2010 Base Year
Oil and gas sector performing poorly, post-2013
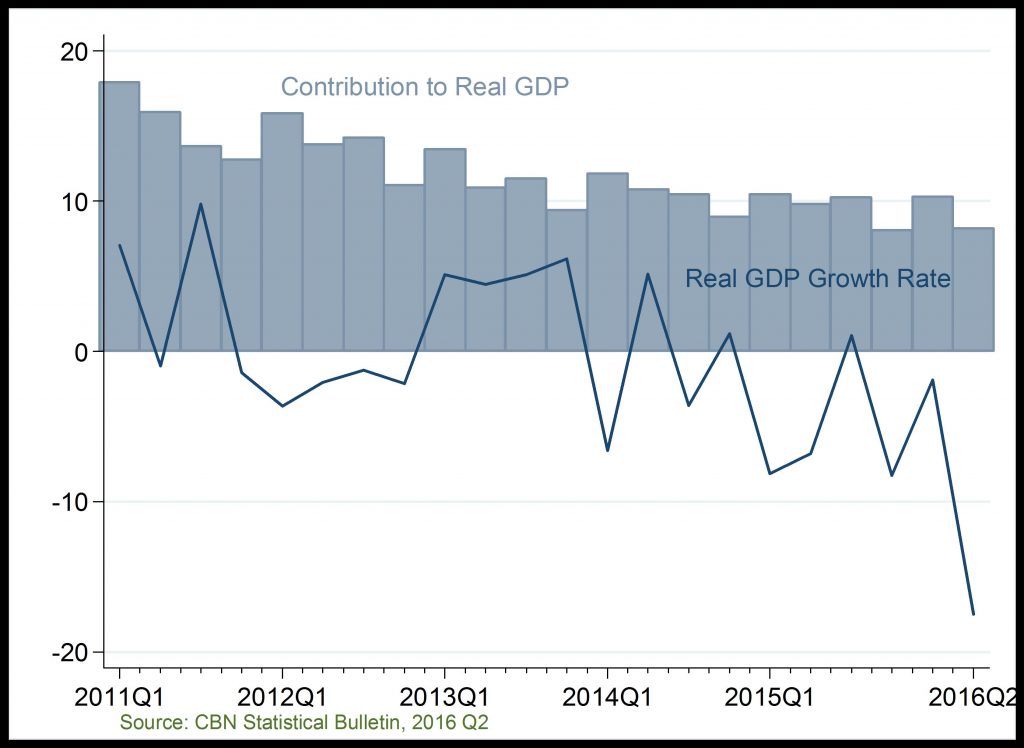
Gross Domestic Product Growth Rate: The growth performance of the Oil and Gas sector has been unsteady throughout years and declined most significantly in 2015Q4, following a positive growth recorded in 2015Q3. The poor growth performance could be attributed to the negative exogenous shocks being experienced by most oil exporters.
Contribution to GDP: The sectors contribution to overall GDP has steadily declined since 2004 reflecting the low level of composite value addition to the Nigerian economy.
Related
Business Confidence Index: After its peak in 2011, business confidence fell sizeably in 2012 as well as 2015Q2. Most recently, BCI has declined to a negative levels in 2016Q1 and Q2. The recent declin
Capital Importation: Since the dramatic decline in 2013, private and government sector investments in the sector have remained low in 2016.
Budgetary Allocation: Budgetary allocations to the transpo
Crude Oil Price: Crude oil price attained a historical low of $30.7 in January 2016 largely due to excess global oil supply.
Crude Oil Production and Export: Oil production has continued to fall in
Internally Generated Revenue: Total internally generated revenue particularly declined across the 36 states in Nigeria, in 2015. This is attributable to the weak macroeconomic and financial conditions