Nigeria’s Ease of Doing Business Ranking: Behind the Numbers

On 24th October 2019, the World Bank’s 2020 Ease of Doing Business report was released announcing that Nigeria has climbed 15-places up to 131 rank out of 190 countries globally. This piece throws more light on the ease of doing business in Nigeria and recommends a manageable three-prong strategy for further reforms – automate, simplify, and inform!

As indicated in the report, a high ease of doing business ranking implies that a country’s regulatory environment is more conducive for starting, operating and expanding local businesses; compared to other countries and the preceding years. Countries that have implemented regulatory reforms in 2018/19 making it easier or harder to do business in three or more of the ten topics compared to preceding years, recorded a growth or decline in the ranking respectively.

In total, 42 countries implemented regulatory reforms improving the ease of doing business over the period. For sub-Saharan Africa (SSA), thirteen countries – including Nigeria, Togo and Rwanda – recorded significant improvements. Although Mauritius is the highest-ranked SSA economy in the ease of doing business, Togo was the biggest improver this year – climbing by 40-places up the rank to the 97th. For Nigeria,  which sits 15-places higher on the Ranking,  it recorded improvement in six out of the ten topics for evaluation: Starting a business; Dealing with construction permits; Getting electricity; Registering a property; Trading across borders; and Enforcing contracts.

The ranking report presenting Nigeria as one of the top improvers in creating an enabling business environment globally was a welcomed news for the Federal Government. Some spheres of the business community corroborate on the progress in the ease of doing business in the country, citing improvements such as visa-on-arrival reforms. However, some business leaders argue that the business environment has not improved, highlighting the presence of counter-productive reforms that restrict business operations; thus, questioning the reflectiveness of the Ranking.

It is important to highlight that the Ranking only measures improvements in the laws and official practices that support formal sector business processes. The scoring mostly accounted for the changes implemented by the Presidential Enabling Business Environment Council (PEBEC) set up in 2016 by the Nigerian government to progressively remove bureaucratic constraints to doing business. Some of the regulatory progress that informed the Ranking for Nigeria include:

  • Starting a business: It now takes just 24 hours (not 10 days) to register a business with the Corporate Affairs Commission (CAC). The registration process now allows for online self-application without the need for a legal adviser. This change reduces the formal cost of starting a business by at least N64,000 ($177); representing the foregone cost of hiring a lawyer and the consolidation of registration documents to a single CAC form. It also reduces some informal costs incurred in the interaction with government officials including transportation, unofficial tips and unnecessary delays. The automated process also makes it easier to link business with tax authorities, dispensing the need for physical registration at the tax office.
  • Dealing with construction permit: By automating and simplifying registration and payment processes, the  cost and number of required documentations for obtaining a construction permit reduced. For instance, the cost of warehouse (small business) construction in Lagos dropped from 26% to 2% of warehouse value.
  • Getting electricity: This does not imply improvement in the reliability of electricity in the country; it only covers the ease of getting new connection to national electricity grid. The online application platform has reduced the connection process to 30 days as opposed several months; particularly in Lagos and Kano.
  • Registering property: The use of professional consultants in the process has helped reduce the time and cost for registering properties in Lagos and Kano.
  • Trading across border: Regulatory reforms led to the reduction of documents for export (from 10 to 7) and for import (from 14 to 8) enabling slightly quicker movement of goods across borders. In addition, the Apapa port in Lagos began 24/7 operation and the Request for Information (RFI) export form was digitized; leading to a 48-hour reduction in time spent for border compliance. The implementation of the single joint cargo  reducing the number of touch points for import clearing  (from 8 to 1) was also a score point  for Nigeria on the rank. Given that the data collection for the Ranking was concluded in May 2019, the impact of the recent closure of Nigerian borders affecting Benin, Cameroon and Niger were not accounted for.
  •  Enforcing a contract: The score points for Nigeria was mainly due to the introduction of small claims commercial court in Lagos and Kano instituted in 2018 and January 2019 respectively. The small claims court allows for faster liquidated damage claims of below N5 million (in Lagos) and below N10 million (in Kano) for small- and medium- size enterprises (SMEs) within 60-days. There is also an opportunity for self-representation in the court. This decongests the High Court and improves entrepreneurs’ ease of taking legal action and getting justice.

However, the country did not experience significant improvement in other Ranking metrics: Paying Taxes, Getting Credit, Resolving Insolvency, and Protecting Minority Investors.

Key Limitations of the Ranking

The Ranking does not cover a broad range of areas pertinent to businesses. As the Ranking report clearly notes, its methodology has two key limitations; suggesting that the skepticism of some Nigerians over the reflectiveness of the Ranking may not be entirely misplaced:

  1. It focuses only on the formal sector and formal processes: It does not reflect the informal sector which makes up to 65% of the Nigerian economy in terms of Gross Domestic Product (GDP). Also, studies show that 90% of employees in Sub-Saharan Africa operate in the informal sector. Particularly, firms in the informal sector typically grow more slowly, have poorer access to credit, do not follow the formal process of business registration – and thus the business and its employees remain outside the legal protections of the law compared to their counterparts. As such, SME owners in the  formal and informal sectors face different realities as they set up and operate their businesses –with the latter more likely to record negative experiences.
  2. It omits a full range of factors, policies, and institutions that affect the quality of an economy’s business environment or its national competitiveness: It does not account for the difficulties caused by some of the biggest challenges in doing business which Nigeria and many countries face globally including: macroeconomic stability, security, state of the financial system, and prevalence of bribery and corruption.

Nevertheless, the Ranking can be deemed reflective for the metrics it covers given that it involves multiple points of information collection and a data verification/validity process. Information is typically sourced from: legal practitioners, private sector respondents, the government and World’s Bank’s regional staff in the country; with an internal review processes and a transparent complaint procedure allowing people to challenge the data.

Recommendations

Although certain key aspects of an enabling business environment are not reflected in the Ranking, the six areas of reforms where Nigeria has recorded improvement were felt by many formal business owners, especially in Lagos and Kano. These reforms not only minimizes the time and cost of doing business for entrepreneurs and the government (in the areas it covers), but also strengthens transparency in payment and government revenue generation.

However, these reforms have been largely limited to Lagos and Kano – which are the only two states the Ranking accounts for. To ensure that these reforms are not aimed at ‘gaming’ the Rankings, these improvements should be extended to other states in the country including southeastern states. Enhancing other government procedures and services for local businesses is required to ease business difficulties in the country, including taxation and obtaining credit – for which the country did not show any significant score progress. Although the Ranking does not cover infrastructure constraints, it remains one of the biggest challenges at a significant cost to Nigerian businesses, particularly electricity reliability and transport network.

Finally: drawing from the case study of the reforms in the Ease of Doing Business, successes in reforming other areas of government services require a three-prong approach:

Automation: Entrepreneurs typically resort to informal activities, when regulatory processes limit their ability to freely operate private businesses, whether by intent or ignorance. Deploying technology and making processes accessible online makes a great deal of difference. The use of modernized information technology infrastructures increases efficiency, reduces physical interactions between government officials and service beneficiaries, and eliminates the physical exchange of cash --which can reduce rent-seeking behaviors. Ensuring little or no human contact in obtaining government services would make a great difference in the ease of doing business; particularly eroding the “unofficial but almost compulsory tips” paid to receive services. Automating processes can also help cut down the number of officials required for a given service, with a significant impact in reducing the huge sum (nearly 50% of budget expenditures) spent annually on government recurrent expenditures.

  1. Simplification: Several required processes for receiving a government services can be consolidated into a fewer processes to reduce the hassle for business and rent-seeking opportunities for officials. Firms tend to opt for informal or unofficial  arrangements to bypass rules where regulation is tedious; thus, economies with burdensome regulations typically have higher levels of informality. Reforms that seek to simplify regulatory processes can make a great difference in serval government services including taxation.
  2. Information: Before, during and after reforms are implemented, end-users or beneficiaries must be made aware of prospective and ongoing changes. Information about the reform should be well-disseminated, first, among the implementers (the agency carrying out the reform) at all levels, then relayed to beneficiaries using the most effective communication channels. While improvement in the ease of registering with CAC was implemented two years ago, for instance, the information only just begone to trickle down to users, and many Nigerians still remain unaware. For a seamless reform, implementers need to be transparent in communicating the benefits and downsides of the change, with complaint procedure to welcome feedback to be improved upon.
Read More

Achieving Inclusive Education in Nigeria

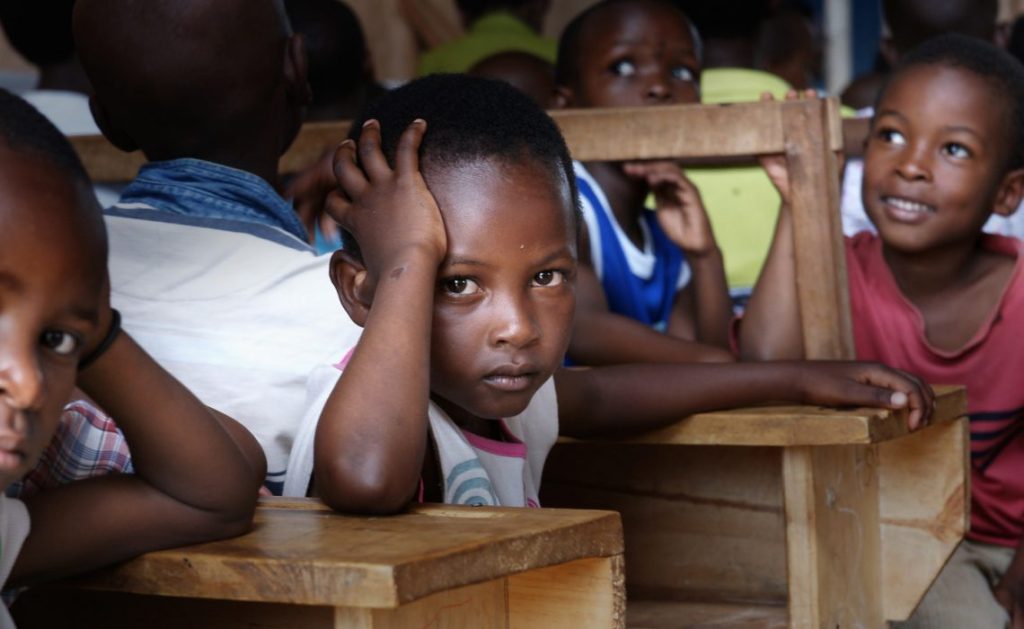
Inclusive education implies that education (quantity and quality) is accessible to all children, irrespective of their individual circumstances. However, in Nigeria, some vulnerable groups of children are found to be excluded from quality education. These include children with disabilities, children from nomadic groups, many of the children in the Almajiri education system, and internally displaced children. Worryingly, the socio-cultural and economic backgrounds of children in Nigeria continue to influence their access to education.

Furthermore, education data shows gaps in access and learning between the popular dimensions of exclusion: gender, location of residence, region, and wealth. These figures often mask the most critical dimensions and their underlying drivers. Such insights are what CSEA’s ongoing research project, on Educational Performance in Nigeria under the framework of the Southern Voice on the State of the SDGs (SVSS), aims to unveil.

In this issue, we highlight some equity concerns relating to access and quality of basic education in Nigeria.

Access

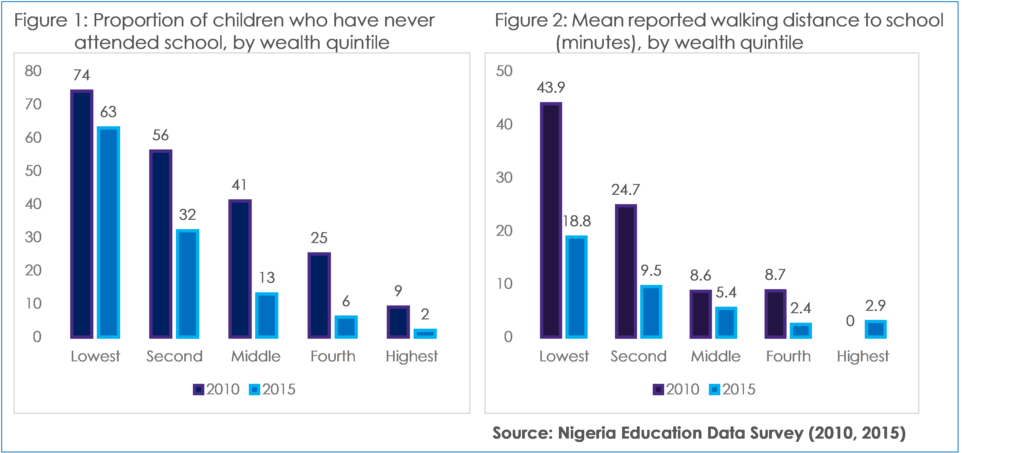
Figure 1 below shows the percentage of children that have never attended school, disaggregated by their economic background. Despite improvements between 2010 and 2015, it is clear that most gains in access accrued to the intermediate wealth quintiles, with most children in the poorest households still excluded. However, walking time to school has fallen, especially for children from the poorest households (Figure 2). Yet, for these poorest households, the remarkable improvement in proximity to schools has not been reflected in attendance by their children. This signals that factors other than proximity to school are hindering their access to school.

The other factors may include non-tuition costs that households have to bear, opportunity cost of sending kids to school, attitudes towards formal education, poor school quality, etc. The recent case of Success Adegor in Delta State illustrates clearly how auxiliary cost of education is driving exclusion. According to NEDS (2015) data, 93.7% of the poorest households reported one or more types of school- related expenditure, despite basic education being free and compulsory in principle. Furthermore, children from poorer households spend less time in school than their counterparts from wealthier households. For instance, 79% of children from the richest households spend at least 7 hours in school compared to just 25% of children from the poorest households. Moreover, the time spent away from school by children from poorer households is often not used for learning-related activities. About 76% of the children from the poorest households do no homework outside school relative to only 16.4% of children from the richest households.

Quality

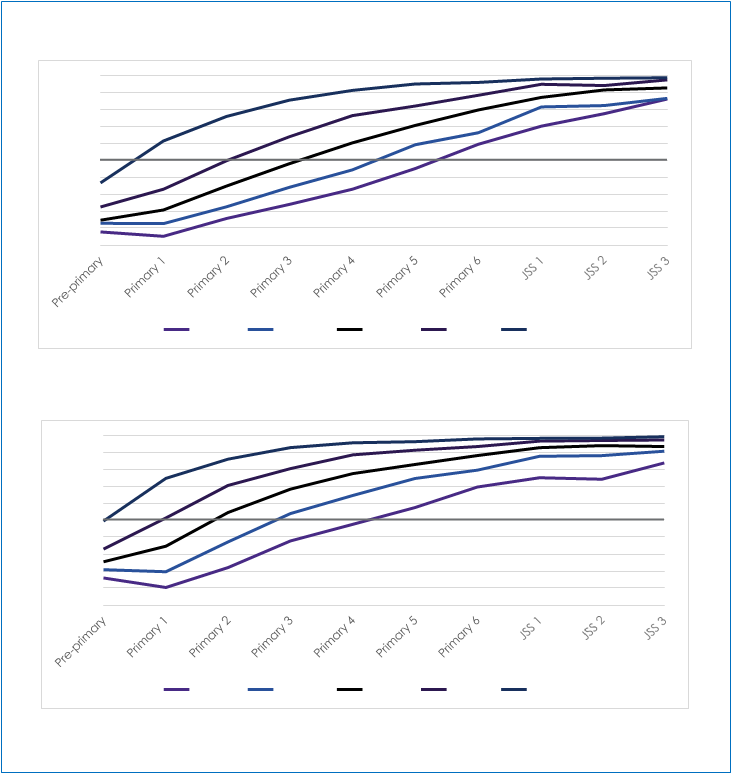
Figure 3 below provides a very simplistic measure of education quality, the ability to read three pre-school level sentences. The figure shows how equitable basic learning is across socioeconomic groups. Specifically, it is observed that children from wealthier households maintain an edge in learning over their counterparts from households in lower wealth quintiles throughout the ten-year period of basic education in Nigeria. Strikingly, it takes until Primary 5 for half of the children from the lowest wealth quintile to become literate, a full 5 years behind the children from the highest wealth quintile.

One can observe similar results when we consider another measure of quality education, numeracy (Figure 4). The children from poorest households are left behind and only until Primary 4 are half of them able to become numerate. Again, a full 5 years behind children from the wealthiest households.

Read More

The 2020 National Budget: right cycle is great, but implementation is better

The reasons for underperformance of budgets are beyond wrong cycle or under-collection of oil revenue. But rather the biggest issues lie in over-ambitious projections, under-performing non-oil revenue and unspent funds by MDAs

Budget cycle in Nigeria is expected to run from January and December. In practise however, budgets are nearly never passed until late into the second quarter of the year. The irregularities in cycle has affected budget implementation and credibility. It is therefore reassuring that efforts are being make to get the budget cycle right with the 2020 national budget. Already, the appropriation bill presentation is the earliest in the last 10years. The parliament has also rolled out plans to ensure speedy passage of the appropriation bill by November and possible assent in December.

Beyond cycle normalisation, budget implementation remains a key challenge. Particularly, experience over the years reveal that the nation’s budget has consistently underperformed even when the budgets are passed into law early. The budgets have been described as ’incredible’ with the government’s inability to consistently and accurately meet both its revenue and expenditure targets. Looking at the budgets for the past eight years between 2011 and 2018 reveal that those for 2013 and 2015 were signed and passed into law in the first quarter of these years. In addition, the budget cycle for both years lasted for 15 months, which is more than the number of legislated months for a normal cycle. However, the budget implementation performance for these years are not quite different from other years when the budgets were passed much later (see Figure 1).

Figure 1:        Budget performance, cycle and date assented

Note: cycle indicates the number of months between the passage of current and succeeding years’ budget.

Source: National budget implementation reports 2011 – 2018

The biggest underperformance issues are on the capital side of the budget with most of the underspending related to capital expenditure. The average actual spending performance of recurrent expenditures against budgeted values between 2011 and 2018 stood at about 92.3%, while the capital is just around 62%. The degree of implementation of Nigeria’s capital spending clearly depict the inability to deliver on public services and achieve developmental objectives. Hence, meeting the nation’s commitments of achieving the Sustainable Development Goals (SDGs) could be an illusion since SDG action begins with credible budgets.

Figure 2:        Capital and recurrent spending performance

Source: National budget implementation reports 2011 – 2018

Over the years, the reason mainly explained for these underperformances is under-collection of oil revenue as a result of fluctuations in oil price or decline in oil production, and sometimes both. However, revenue performance between 2011 and 2018 reveals that oil revenue collections was about 78% over these years, with average difference of about 22% between the actual and budget projection. Further scrutiny reveals that the under collections of oil revenue were mainly as a result of poor production projections and not price variations. The Oil Price-Based Fiscal Rule (OPFR) which has been in operation since 2004 has ensured that volatilities in international crude oil price are curtailed by setting an oil price benchmark that is below the projected international rate (see Figure 3). Therefore, the problems associated with budget underperformance are explained by other factors.

Figure 3:        Average annual oil price (actual versus budget estimate benchmark)

Source: National budget office and United States  Energy Information Administration

Underperformances of estimated revenue were mainly recorded in the non-oil revenue sources which include collections for Value Added Tax (VAT), Company Income Tax (CIT) and revenue from independent sources (Figure 4). The reasons for the underperformances of non-oil revenues could be that the revenue projections were high and unrealistic or there are leakages and non-remittances by revenue collectors. Others include are weak administrative and monitoring mechanisms, defective and bureaucratic procurement systems that often lead to unnecessary delay in capital spending, and weak legislative oversight among others.

Figure 4: Revenue collection underperformance (2011 – 2018)

Source: National budget implementation reports 2011 – 2018

Improving budget performance to achieve optimum implementation and thus achieve budget credibility requires a combination of different tasks and priorities. Some of these have been well documented in extant articles and literature. However, we attempt to reiterate some of these proposed solutions. First, the projections of revenue and expenditure should be targeted towards realisable estimates to ensure optimum performance. For example, the capital spending estimate for 2015 was reduced by about 50% from 2016 estimates. The capital expenditure performance recorded for that year stood at the record highest of 99%.

In addition, the introduction of a clear, concise and publicly accessible ex-ante and ex-post budget reports in addition to improved institutional coordination throughout the budgetary cycle, from conception to implementation, could enhance the credibility of the budget. Furthermore, synchronisation of published details of revenue and expenditure reports that capture actual against the budget that is consistent with international standards would further ensure performance monitoring, effective implementation and comparative analysis.

Finally, prevalence of unspent funds by Ministries, Agencies and Departments (MDAs) has further contributed to the implementation gaps in capital spending. Unspent and returned capital vote by MDAs have consequential implications on fiscal governance and performance of the budget, especially capital spending. Hence, the incidences of unspent budgets should be abated. Failure to implement budgets by MDAs, when funds are allocated and available, could be viewed as fraud and abdication of responsibility, and such should be treated accordingly.

Read More

Early Child Education: The Most Important; Yet The Most Neglected

Education is acknowledged largely as a significant tool because it equips students with the functional skills for decent living and generates human capital that can spur economic development. Education has many levels, each of which is essential in its distinctiveness and therefore requires adequate public investment.

In Nigeria, government’s policy design and investment focuses mainly on three levels: primary, secondary and tertiary education. In fact, it is not far-fetched to assume that most Nigerians think these are the only levels of education. Government policy, in part, feeds into this narrative with the division of the education system into structures like 6-5-2-3 or more recently 6-3-3-4, in which only primary, secondary and tertiary education are emphasized.

However, there is a fourth level of education—the Early Childhood Education (ECE) which starts from birth through the pre-school, until the child enters the primary level of education. ECE was officially recognized in Nigeria in the 2013 National Policy on Education, with the introduction of 1-6-3-3-4 system. The additional one year covers ECE and was designed to be free and compulsory, thereby extending basic education from 9 to 10 years. According to National Policy of Education (2013), the goal of the ECE is to facilitate transition from home to school and prepare children for primary level of education.

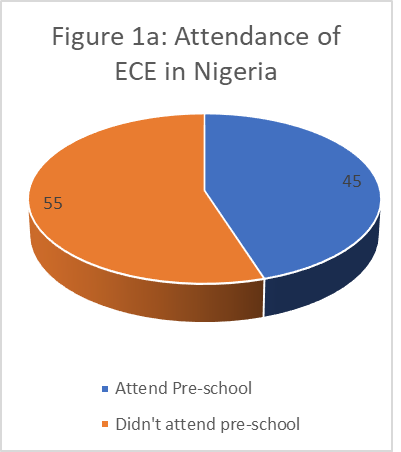
This belated recognition of ECE has not raised its status in any significant way. As shown in Figure 1a, among the pupils enrolled in Primary 1 to Junior Secondary School in 2015, only 45% have attended pre-school. It is also telling that the pattern of pre-school attendance reflects the typical dimension of exclusion in education in Nigeria. Specifically, about 75% of those that have not attended pre-school are from rural areas, while non-attendance is highest among children from the poorest households (Figure 1b). Overall, this data suggests that the majority of children transit directly from home into primary school. While home and family education is an important component of ECE, attending pre-school could ensure seamless transition to primary education.

Source: Nigeria Education Survey (2015)

Government neglect of ECE is evident due to a lack of specialized regulatory institution for it compared to other levels of education. The running and operation of pre-school centers is entirely situated with private sector and social development centers, with some level of oversight from the state ministries of education.

Despite the National Policy on Education (2013) incorporating the ECE into the basic education framework, the scheme has not been implemented in any state in the country. In fact, while funding for all levels of education is poor in Nigeria, ECE has no funding commitment from any arms of government, except modest allocation that could use for ECE as part of primary education budget. The implication  government’s neglect is that ECE becomes accessible mostly to middle- and high-income earners (Figure 1b), thereby excluding children from poor households.

Figure 2 compares the performance of Primary 1 to JSS students based on attendance of preschool. Performance is defined by the ability to meet minimum competency in numeracy and literacy such ability to read and comprehend and do simple arithmetic. By this estimate, 76% of students that attend pre-school meet the minimum benchmark in numeracy, compared to 37% for those that did not attend. Similarly, 69% of those that attend pre-school are estimated competent in literacy, compared to 33% for that did not.

The difference in performance could come from other factors like parents’ education and income; 11% points and 8% points difference in numeracy and literacy performance based on attendance of pre-school. Hence, it can be deduced that part of the learning crisis observed in Nigeria is due to the neglect of ECE.

Source: Nigeria Education Survey (2015)
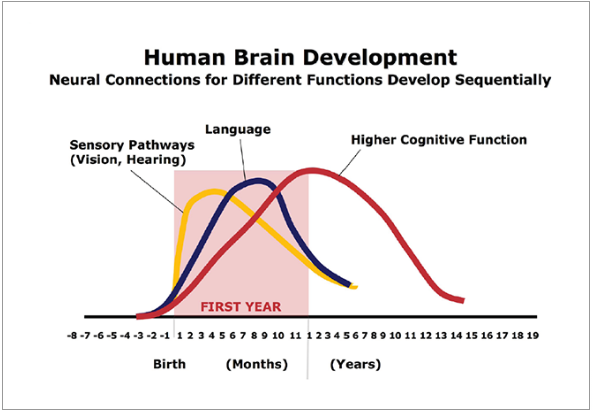
A more fundamental concern is the lifelong impact of neglecting ECE. Broad consensus emerging from neuroscience and behavioral research is that the most critical cognitive and non-cognitive skills are developed in the first few years.  For example, Figure 3 shows that children develop vison, hearing and language skills in their first year. Higher cognitive function also peaks in first year, but the overall development process continues until age 14. Similarly, a child’s emotional and physical health and social skills are developed in early years of life and these skills contribute significantly to both success in school and community in the later years. Parents’ role is elemental in this process, however there might be a point that professional care giver skills will be more essential. The literature on ECE mostly recommends gradual transition from home to school or start of formal ECE between age 2 and 3. This means vibrant and quality ECE is a core and prerequisite component of the education system for any country.

Figure 3: Human Developmental Phases

Source: C.A. Nelson (2000)

Economist James Heckman has examined the rate of return on investment in all levels of education from pre-school to tertiary level and post-school training (on the job training). Interestingly, return to preschool is the highest, followed by primary, secondary and tertiary education. This evidence is the basis of the Heckman curve (Figure 4) which illustrates the declining return to each addition level of education after preschool.  By one estimate, a dollar investment on ECE yields 7 dollars in return to society in terms of more productive and healthier workforce and better community and family support (Heckman, Moon and Pinto, 2010[1]).

Heckman curve

Source: James Heckman (2006)

From the foregoing, ECE is arguably the most important level of education. It is therefore crucial that its relevance is recognized through sound policy and institutional frameworks and funding to ensure that Nigeria achieves its ambitious educational goals and broader economic development. The starting point towards improving the relevance and performance of ECE in Nigeria will be for the 36 state governments including Federal Capital Authority Management to implement the NPC (2013), especially the component relating to integration of ECE to basic education framework, increase funding, creating a specialized institution for regulation and agenda setting. Standards and performance of ECE cannot rise above the teaching manpower within education sector; hence there is need for a teacher’s training component to ECE intervention. Lastly, parents play the most crucial role in delivery of quality training for children. The locus of accountability must therefore be given to parents. However, to effectively play this role, more public enlightenment and engagement should be provided to ensure parents understand the importance of ECE and their role in its effective delivery.

[1] Heckman, J. J., Moon, S. H., Pinto, R., Savelyev, P. A., & Yavitz, A. (2010). The Rate of Return to the High/Scope Perry Preschool Program. Journal of Public Economics, 94(1-2), 114–128.

Read More

The Global South and development assistance

While cooperation between countries in the global South has existed since the 1955 Bandung Asian-African conference, South-South cooperation (SSC) has recently experienced rapid growth and rising global prominence. In 2013, the value of SSC across the world was estimated to exceed $20 billion, up from about  $16.1 billion in 2011. In 2016 alone, over 500 projects were ongoing under the SSC framework in over 120 countries. The growth of SSC is in the context of the economic expansion of countries in the global South such as China, alongside their rising influence in the international political system. As such, a new class of development cooperation actors have emerged as major providers of finance, technology, and knowledge. As aid critics point to the use of development assistance to promote the economic interests of developed countries and exert influence on the foreign policy of the recipient countries, assistance from developed countries has become increasingly viewed with skepticism. With solidarity, shared values, and common interest as its distinct elements, SSC is being presented as a suitable complement to the traditional model of development assistance.

While SSC is not new, its form is. Until recently, SSC was mainly focused on knowledge sharing and capacity building, but now there is an increasing focus on providing finance for development projects, particularly in the infrastructure and the productive sectors such as agriculture and industry. The establishment of the New Development Bank and the Asian Infrastructure Investment Bank to finance development projects in the BRICS countries (Brazil, Russia, India, China, and South Africa) and the Asia-Pacific region, are key examples. Aside from these multilateral banks, a number of Southern-owned development cooperation funds have been created including the Mexico-Chile Joint Cooperation Fund; FAO-China Fund; India, Brazil and South Africa (IBSA) Fund; and India-U.N. Development Partnership Fund. This new financing from and for the South serves as an alternative to the prevailing system of development cooperation by fostering a participatory approach to development, encouraging collective self-reliance, and creating more integrated development cooperation.

Another key development is the ongoing institutionalization of SSC: Chile, Turkey, Thailand, Palestine, and China are some of the emerging countries that have established dedicated agencies for international development cooperation. The mainstreaming of SSC in the agenda of governments, civil society, and research organizations puts SSC forward as a means to mobilize science, technology, finance, and other means of implementation required to implement the sustainable development goals.  SSC is no longer seen as an independent framework but as part of the larger global development architecture.  In order to better understand the role these agencies are playing in development, in Nigeria, the Centre for the Study of the Economies of Africa in partnership with the Asociación de Investigación y Estudios Sociales (ASIES) in Guatemala, recently developed a conceptual framework to document aspects of SSC initiatives in order to allow for easy comparison.

Notably, African countries themselves are playing key roles in the development of the region. South Africa and Nigeria, with the largest economies and most substantial resources in Africa, are providing assistance to poorer countries in the continent. Already, South Africa leads in the SADC region in providing technical and humanitarian assistance needs, as well as facilitating peacekeeping operations which positions it as a major player in the region. Similarly, Nigeria provides a range of development assistance programs, including concessional finance to less-developed countries, technical assistance, and peacekeeping missions.

In these and other ways, developing countries are playing a more proactive role in meeting the development needs of their compatriots. However, the motivation of the emerging development partners is open to question. With non-African donor countries placing value on resource transfers, these development partnerships are hardly free from promoting the interest of the donor. Even for Nigeria and South Africa, their political ambition to achieve hegemonic powers and the subtle contest between both countries for soft power at the continent-level seems to be linked to their willingness to provide development assistance. If countries are more driven by their self-interests, SSC could create a center-periphery relationship where the emerging countries are at the center and the rest of the South are at the periphery.

Moreover, while proponents of SSC argue that it is a development partnership between peer countries, thus quite distinct from traditional North-South cooperation, critics question this assertion as developing countries are at different stages of economic development. A different strand of argument is that SSC is an ideological construct based on the consensus that there is considerable scope for improvement in the traditional development assistance framework. Despite these emerging issues, SSC reflects a more accountable form of development assistance where developing countries take up responsibility and utilize their resources for the pursuit of domestic needs.

To achieve a more effective and efficient cooperation between SSC member countries, we make the following recommendations:

Increased coherence within SSC and between SSC and North-South Cooperation is required to improve knowledge sharing, meet recipient needs, and avoid reinventing the wheel. Mainstreaming SSC into national development policies and creating a forum for the heads of the specialized development agencies and ministries/departments of foreign aid are critical steps towards enhancing policy and institutional coherence. With SSC still a small component of development cooperation, and developing countries still reliant on the North for support, a more coordinated SSC will improve opportunities for collaborating with the North for development.

Developing a general system for data collection and dissemination, like the OECD-DAC countries, is crucial in improving the design, implementation, and evaluation of SSC initiatives, as well as providing knowledge on its scale and scope. While the plurality of approaches may make the exercise cumbersome, member countries working with regional bodies can develop a common methodology that accounts for both financial and non-financial modalities.

A common evaluation framework that accounts for the diversity of SSC initiatives is required for enhanced learning and accountability. While a number of frameworks have been developed by research organizations and academia in the South, there is no common assessment system for countries to track a program’s progress and explain differences in outcome. Given the horizontal nature of SSC, member countries should agree on a system for evaluating initiatives in order to improve resource use for development.

This article was first published on Brookings Institute 

Read More