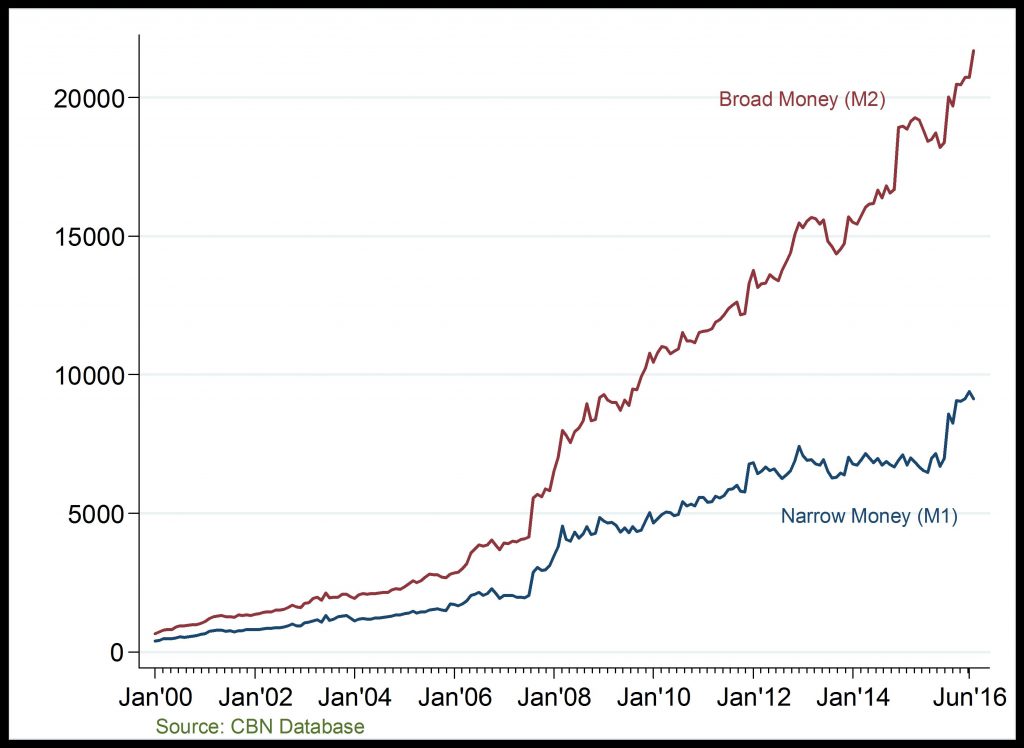
Money Supply (Billion )
Rising money supply
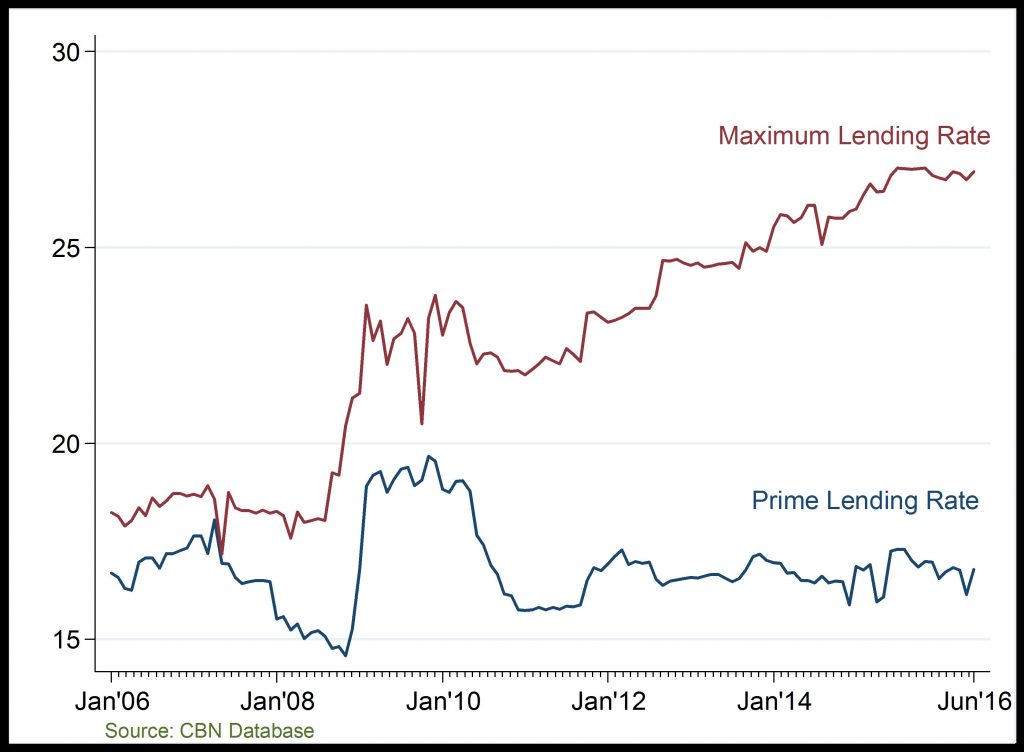
Lending Rate (%)
Expensive loans
Money Supply: On a month-on-month basis, growth in M2 have accelerated overtime; reaching over N20,000 billion by April 2016. The rise in M2 at the end of 2016Q1 reflects the fast-paced rise in aggregate domestic credit and other assets relative to pre-2008 period. Similarly, M1 grew sharply at the end of 2016Q1 due to the increase in its demand deposits and currency outside banks components.
Lending Rate: Lending rates co-moves with changes in liquidity and money supply. The gap between maximum and prime lending rates began to widen in 2010; reflecting higher liquidity in the banking system. Both the maximum and prime lending rate trended downwards in 2016Q1 on the account of liquidity ejection in the banking system, at the time.