Money Supply And Lending Rate
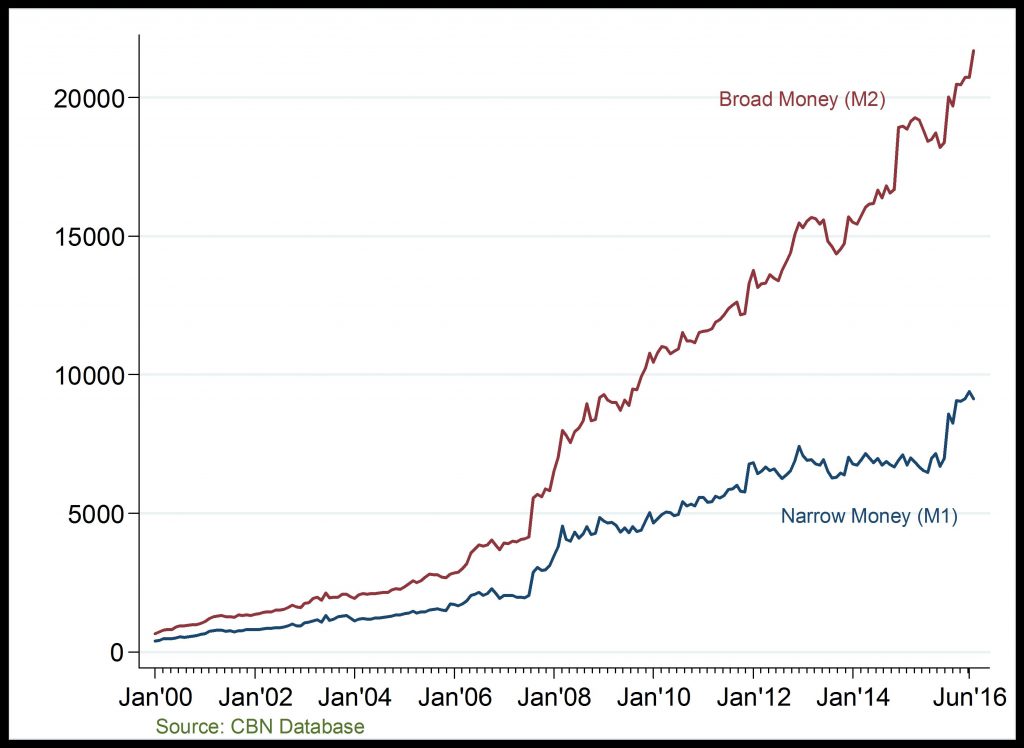
Money Supply (Billion )
Rising money supply
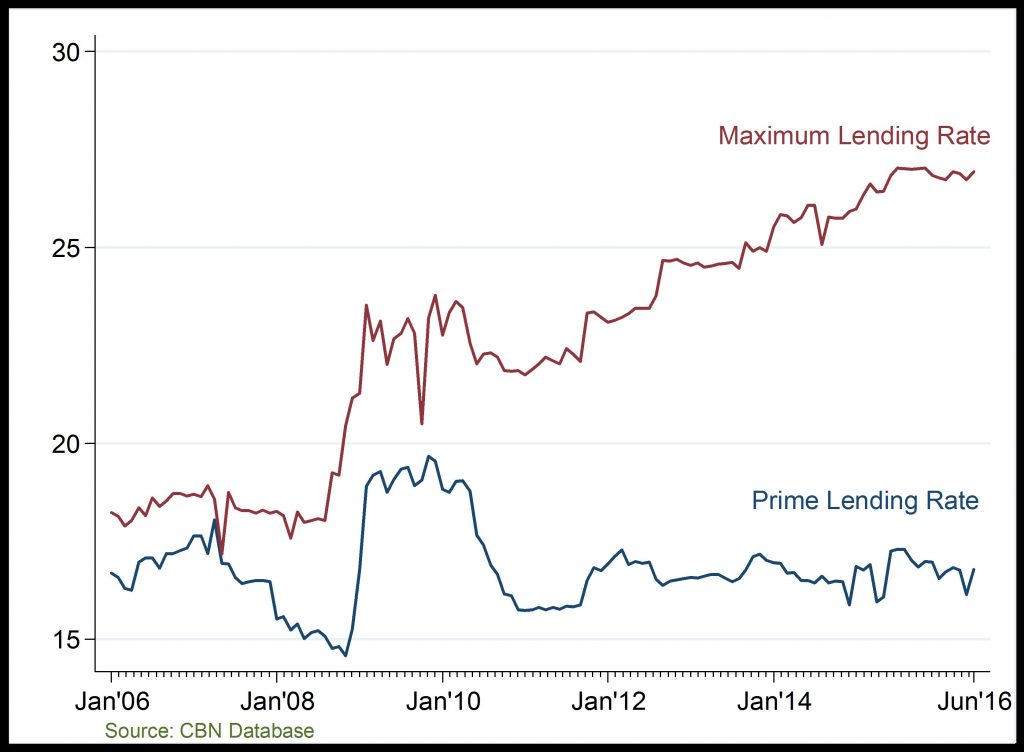
Lending Rate (%)
Expensive loans
Money Supply: On a month-on-month basis, growth in M2 have accelerated overtime; reaching over N20,000 billion by April 2016. The rise in M2 at the end of 2016Q1 reflects the fast-paced rise in aggregate domestic credit and other assets relative to pre-2008 period. Similarly, M1 grew sharply at the end of 2016Q1 due to the increase in its demand deposits and currency outside banks components.
Lending Rate: Lending rates co-moves with changes in liquidity and money supply. The gap between maximum and prime lending rates began to widen in 2010; reflecting higher liquidity in the banking system. Both the maximum and prime lending rate trended downwards in 2016Q1 on the account of liquidity ejection in the banking system, at the time.
Related
FDI, FPI and other Investments: The unusual fall in overall capital importation, especially in equity investment, in the late 2015 and early 2016 is attributable to the tougher macroeconomic and finan
Gross Domestic Product Growth Rate: The information and communication sector has grown overtime but witnessed an unusual decline in 2011, which has remained low in 2016Q1 possibly due to declining con
Net Foreign Exchange Flows through the Nigerian Economy: The recent fall in foreign exchange earnings reflects the decline in both oil sector receipts from CBN, and non-oil sector inflows from autonom
CPI and its Component: Changes in inflation rate has mostly been driven by the Core sub-index component. Precisely, in 2016 Q1 and Q2, the rising cost of import, electricity and transport drove inflat